Upflow temperatures in submarine hydrothermal systems
During the last session we have explored free hydrothermal convection in a porous medium heated from below. That 2-D setting can be thought of as hydrothermal convection in an along axis slice above a stable melt lens - for example at a fast spreading ridge. Two things are striking about our initial results. First, in the homogenous permeability case, vent temperatures never exceed 400°C although the bottom boundary condition was set to 800°C. Shouldn’t it be the hottest and most buoyant fluids that rise in free convection? Second, in the layered case, mixing at the interface to the higher permeability layer resulted in a reduction in vent temperature. What is controlling this reduction in the upwelling temperature?
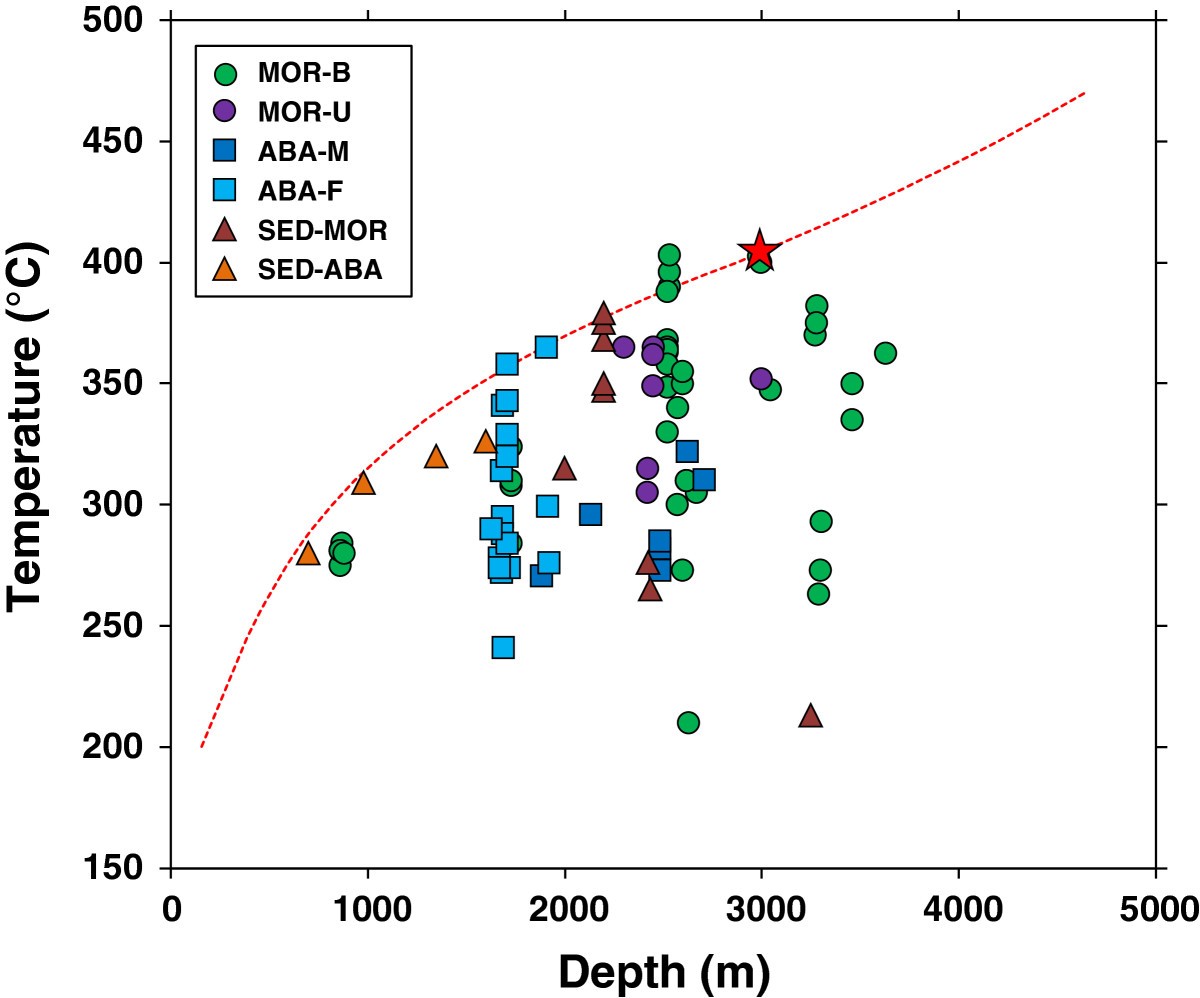
If we turn to observations to adress these question, we notice another striking feature of submarine hydrothermal systems. Global compilations of vent fluid exit temperatures demonstrate that these rarely exceed approx. 400°C (Fig. 22 ).

Fig. 22 Figure taken from [Nakamura & Takai, 2014] showing measured vent fluid temperatures.
So, what controls the upflow temperature in submarine hydrothermal systems? This question was adressed by [Jupp & Schultz, 2000] in a landmark paper. They showed that the thermodynamic properties of water control the upflow temperature and can explain the observed upper limit of vent fluid temperatures. In this lecture we will have a detailed look into the underlying mechanisms.
Mechanism to limit black smoker temperature
We recommend reading the original papers by [Jupp & Schultz, 2000] and [Jupp & Schultz, 2004]; here we only provide a very short summary. The underlying idea is to determine from the pure water equation-of-state the optimum temperature for buoyant upwelling. Within the energy conservation equation, advective heat transport is described by a divergence term:
Following [Jupp & Schultz, 2000], we can assume that the pressure gradient, driving upflow, can be approximated as cold hydrostatic so that we can express the upflow velocity as:
Now we plug this expression into equation (29) to get:
The minus on the left-hand term is a bit irritating. We can continue by assuming that \(g=9.81\), so is positive. [Jupp & Schultz, 2000] called the term within the large brackets, \(F=\left(\frac{(\rho_0 - \rho) \rho h}{\mu}\right)\) , fluxibility. Fluxibility is a function of fluid properties only and those properties are pressure and temperature dependent. To first order, advective heat transport is maximized, where \(\nabla \cdot F\) is maximum and this divergence can be approximated within the bottom thermal boundary as \(\nabla \cdot F \approx \frac{\partial}{\partial z} F\) and this term is to first-order proportional to \(\frac{\partial}{\partial T} F\) .
Fig. 23 a shows fluxibility as a function of pressure and temperature. It is clear that this function has a distinct peak at temperature of approximately 400°C. Fig. 23 b shows sections of constant pressure and also the derivative of F with temperature. The peaks in these functions mark the temperature for which buoyant heat transport is most efficient for a given pressure. Later we will explore this further in numerical convection experiments.
Fig. 23 Fluxibility F as a function of temperature and pressure (a), profile of F along temperature with constant pressure (b).
Let’s have a look into the controlling fluid properties density, specific enthalpy, and dynamic viscosity in P,T space.
Fig. 24 Phase regions of pure water in P-T space. We are mainly interested in the supercritical region above the critical end point, when water is always in the single phase regime.
Fig. 25 Density (\(Kg/m^3\)) as a function of pressure and temperature. There is a monotonic rise in density with increasing pressure and and decreasing temperature - just as intuition would tell us.
Fig. 26 Specific enthalpy (\(J/Kg\)) as a function of pressure and temperature. The energy “stored” in a kilogram of water rises with increasing tempeature - also no surprises here.
Fig. 27 Viscosity (\(Pa s\)) as a function of pressure and temperature. Here things get interesting; the viscosity is first going down with increasing temperature (as expected) but then increases again within the vapor phase field.
Looks like viscosity may play a big role in determining flow dynamics and upwelling temperatures. Let’s explore this in more detail.