Jupyter Notebook of case results
[1]:
import matplotlib as mpl
import matplotlib.pyplot as plt
import numpy as np
import scipy
import scipy.interpolate
from matplotlib.ticker import MultipleLocator
from mpl_toolkits.axes_grid1.inset_locator import inset_axes
from matplotlib.colors import ListedColormap
import meshio
import os
from iapws import IAPWS97
import warnings
warnings.filterwarnings("ignore")
from vtk import *
from vtk.util import numpy_support as VN
#===============================================================
# config font
mpl.rcParams['font.family'] = 'Arial'
mpl.rcParams['font.size'] = 12
mpl.rcParams['mathtext.fontset'] = 'cm'
sec_year=86400*365
cm2inch=1 #0.393701
dpi=600
# path----------
path_figures='../../../../../_figures'
Read results
Using
foamToVTKutility convert OpenFOAM result to VTK format, e.g.foamToVTK -time '823328000000' -useTimeNameRead VTK file (Ustructured data) using meshio
Triangulate the unstructured data using
mpl.tri.Triangulation(doc) function
[2]:
# read vtk file generated by `foamToVTK`
# vtk unstructured mesh
def readVTK_2D(vtkfile,positiveDepth=True,scale_coord=1):
    data=meshio.read(vtkfile)
    points=data.points
    x,y=points[:,0]*scale_coord,points[:,1]*scale_coord
    if(positiveDepth):
        y=-y
    cells=data.cells[0].data
    triangles=cells[:,0:3]
    point_data=data.point_data
    cell_data=data.cell_data
    cell_perm=cell_data['permeability'][0]
    trimesh=[]
    if(cells.shape[1]>3):
        trimesh=mpl.tri.Triangulation(x,y)
    else:
        trimesh=mpl.tri.Triangulation(x,y,triangles)
    return trimesh, point_data,cell_data
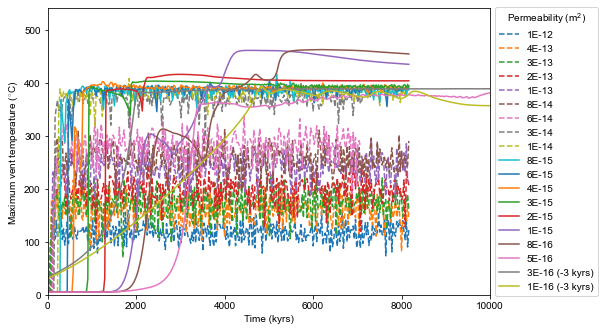
Maximum vent temperature changes with time
[3]:
path_results='../HS86kw/results'
permeabilities=[1E-16,3E-16,5E-16,8E-16,1E-15,2E-15,3E-15,4E-15,6E-15,8E-15,1E-14,3E-14,6E-14,8E-14,1E-13,2E-13,3E-13,4E-13,1E-12]
ventT={'min':[],'max':[],'mean':[]}
for key in ventT.keys():
    ventT[key]=np.zeros_like(permeabilities)
[6]:
fig=plt.figure(figsize=(8.5,4.95))
ax=plt.gca()
ls='solid'
start_steadState=-100
for i in range(len(permeabilities)-1,-1,-1):
    perm=permeabilities[i]
    fname_ventT=str('%s/ventT_%.0E.txt'%(path_results,perm))
    data=np.loadtxt(fname_ventT)
    t=data[:,0]
    T=data[:,1]
    ventT['mean'][i]=np.mean(T[start_steadState:-1])
    ventT['min'][i]=np.min(T[start_steadState:-1])
    ventT['max'][i]=np.max(T[start_steadState:-1])
    print(' %.0E, %.0f, %.0f, %.0f'%(perm, ventT['min'][i], ventT['mean'][i], ventT['max'][i]))
    if(i//10 ==0):
        ls='solid'
    elif(i//10 == 1):
        ls='dashed'
    elif(i//10 == 2):
        ls='dotted'
    if(perm<5E-16):
        ax.plot(t-3000,T,label='%.0E (-3 kyrs)'%(perm),ls=ls)
    else:
        ax.plot(t,T,label='%.0E'%(perm),ls=ls)
ax.legend(ncol=1,bbox_to_anchor=(1,-0.02),loc='lower left',title='Permeability (m$^{\mathregular{2}}$)')
ax.set_xlabel('Time (kyrs)')
ax.set_ylabel('Maximum vent temperature ($^{\circ}$C)')
ax.set_xlim(0,10000)
ax.set_ylim(0,540)

plt.tight_layout()
plt.savefig('%s/ventT_time_perm.pdf'%(path_figures))
plt.savefig('%s/ventT_time_perm.jpg'%(path_figures),dpi=400)
plt.show()
 1E-12, 73, 118, 157
 4E-13, 83, 160, 210
 3E-13, 106, 175, 223
 2E-13, 120, 200, 258
 1E-13, 178, 241, 292
 8E-14, 200, 254, 311
 6E-14, 190, 282, 337
 3E-14, 323, 369, 400
 1E-14, 357, 382, 395
 8E-15, 363, 384, 403
 6E-15, 355, 387, 395
 4E-15, 381, 390, 399
 3E-15, 386, 393, 399
 2E-15, 403, 404, 404
 1E-15, 435, 446, 459
 8E-16, 454, 460, 462
 5E-16, 482, 482, 482
 3E-16, 389, 390, 391
 1E-16, 337, 342, 345

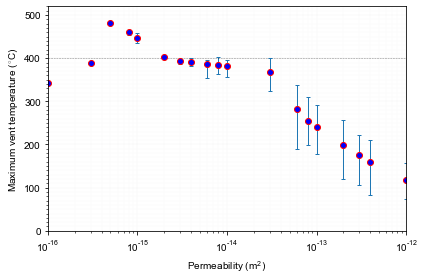
Vent temperature as a function of permeability
[7]:
fig=plt.figure(figsize=(6,4))
ax=plt.gca()
permeabilities=np.array(permeabilities)
# ax.semilogx(permeabilities,ventT['mean'],'o')
ax.errorbar(permeabilities,ventT['mean'], yerr=[ventT['mean']-ventT['min'], ventT['max']-ventT['mean']],
            capsize=2, elinewidth=1, marker='o',mec='r',mfc='b', linestyle='none')
ax.set_xscale('log')
ax.hlines(400,permeabilities.min(),permeabilities.max(),ls='dashed',color='k',alpha=0.5,lw=0.5)
ax.set_xlabel('Permeability (m$^{\mathregular{2}}$)')
ax.set_ylabel('Maximum vent temperature ($^{\circ}$C)')
ax.yaxis.set_major_locator(MultipleLocator(100))
ax.yaxis.set_minor_locator(MultipleLocator(10))
ax.xaxis.set_major_locator(mpl.ticker.LogLocator(base=10.0, subs=(1.0,),numticks=20))
ax.xaxis.set_minor_locator(mpl.ticker.LogLocator(base=10.0, subs=np.linspace(0.1,0.9,9),numticks=20))
ax.grid(which='major',color='gray',lw=0.05)
ax.grid(which='minor',color='lightgray',lw=0.05)
ax.set_ylim(0,520)
ax.set_xlim(permeabilities.min(),permeabilities.max())

plt.tight_layout()
plt.savefig('%s/ventT_perm.pdf'%(path_figures))
plt.savefig('%s/ventT_perm.svg'%(path_figures))
plt.show()

[ ]: