Project 2: How long can a magmatic intrusion sustain high temperature venting?
Project objectives
Explore how long magmatic intrusions can sustain a hydrothermal circulation system
Constrain the break-through time of the hydrothermal plume
Interpret the results in the context of mineral systems
The second exercise explores how long a magmatic intrusion can sustain a high-temperature hydrothermal system and how much of a time lag exists between the magmatic event and the formation of a vent site. These king of insights are highly relevant to large number of research questions.
For example, it remains notoriously difficult to explain the discharge fluxes inferred for mid-ocean ridge vent fields [Baker, 2007] [Germanovich et al., 2015] . In this context, it is very interesting to know what kind of discharge fluxes a magmatic intrusion can sustain and over which time scales.
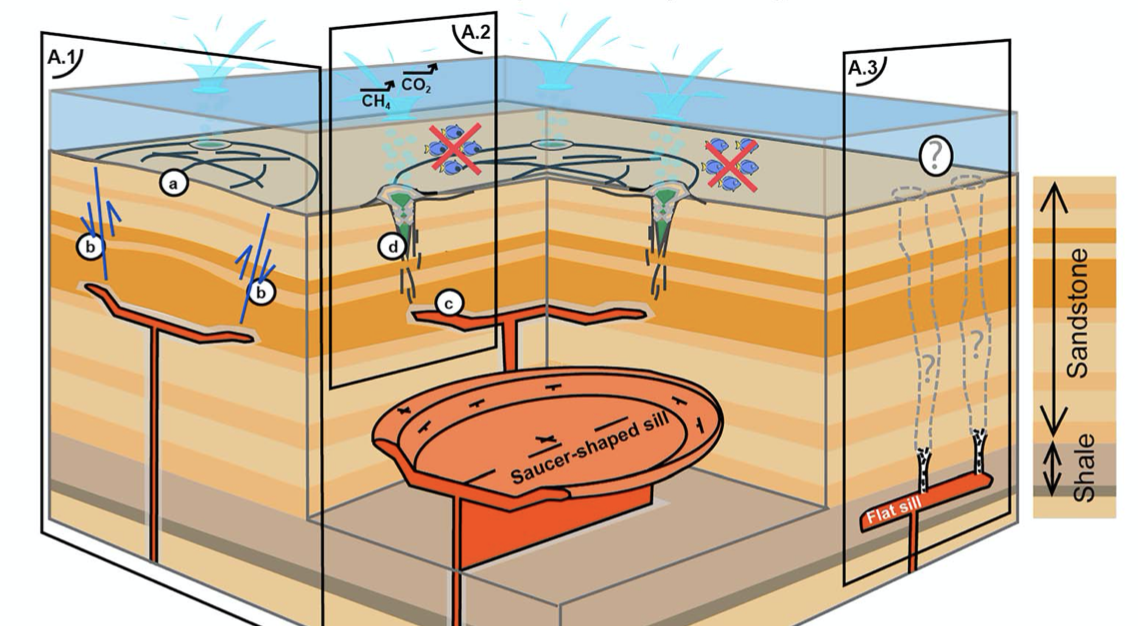
Another examples are sill complexes in sedimentary basins, which are thought to release of large volumes of greenhouse and toxic gases into the atmosphere thereby playing a role in global change [Svensen et al., 2004] [Aarnes et al., 2010] [Iyer et al., 2017]. Also here is is important to understand the time lags between sill emplacement and the onset of hydrothermal venting.
Finally, there has been an interesting discussion over the past years on whether glacial sealevel changes can affect crustal production at mid-ocean ridges [Lund & Asimow, 2011], sparked by the discovery of Milanchovitch frequencies in abyssal hill spacing [Crowley et al., 2015]. Some studies tried to progress on this question by looking at hydrothermal deposits and the time lag between deposit formation and sealevel forcing [Lund et al., 2016]. While these topics are out of the scope of this lecture, they do illustrate the necessity to link magma emplacement to vent formation.

Fig. 50 Figure taken from [Galerne & Hasenclever, 2019] on sill intrusions and hydrothermal venting in sedimentary basins.
Technicalities
Solver changes
The cooling of magmatic intrusions is associated with a latent effect of the crystallization process. A convenient way of accounting for this effect is to use an effective specific heat for the solid phase in the energy equation (see e.g. [Aarnes et al., 2010]).
We can do this by modifying the transient term of the energy equation:
These changes are implemented in a modified solver of HydrothermalFoam, which you can download from here (HydrothermalSinglePhaseDarcyFoam_Cpr).
Check the updateProps.H and createFields.H files, how these changes are implemented.
Setup fields
In addition to the solver changes, we have to take extra care of the initial conditions. The temperature field is not uniform anymore but we need to set the initial intrusion temperature to a high value according to its cellzone and apply a background temperature gradient (if we think that’s useful).
These changes are implemented as codestream statements in 0/T . Have a look!
Deliverables
The goal of this project is to provide work on these topics
Intrusion driven circulation, provide a sequence of 2D simulations that illustrate what can “happen” for different intrusion geometries and host rock permeabilities.
Systematics, provide “phase diagrams” on breakthrough times, the time to vent, and vent durations, the time high-T venting is sustained, for different model parameters like intrusion volume, depth, permeability..
Vent temperature, provide information on the relationship between the host rock permeability and maximum vent temperature.
The results showed be delivered in a short powerpoint presentation.
Starting point
Case file
Download the basic case file from (Intrusion Flow Model).. It includes a basic setup for hydrothermal system drive.
Meshing software
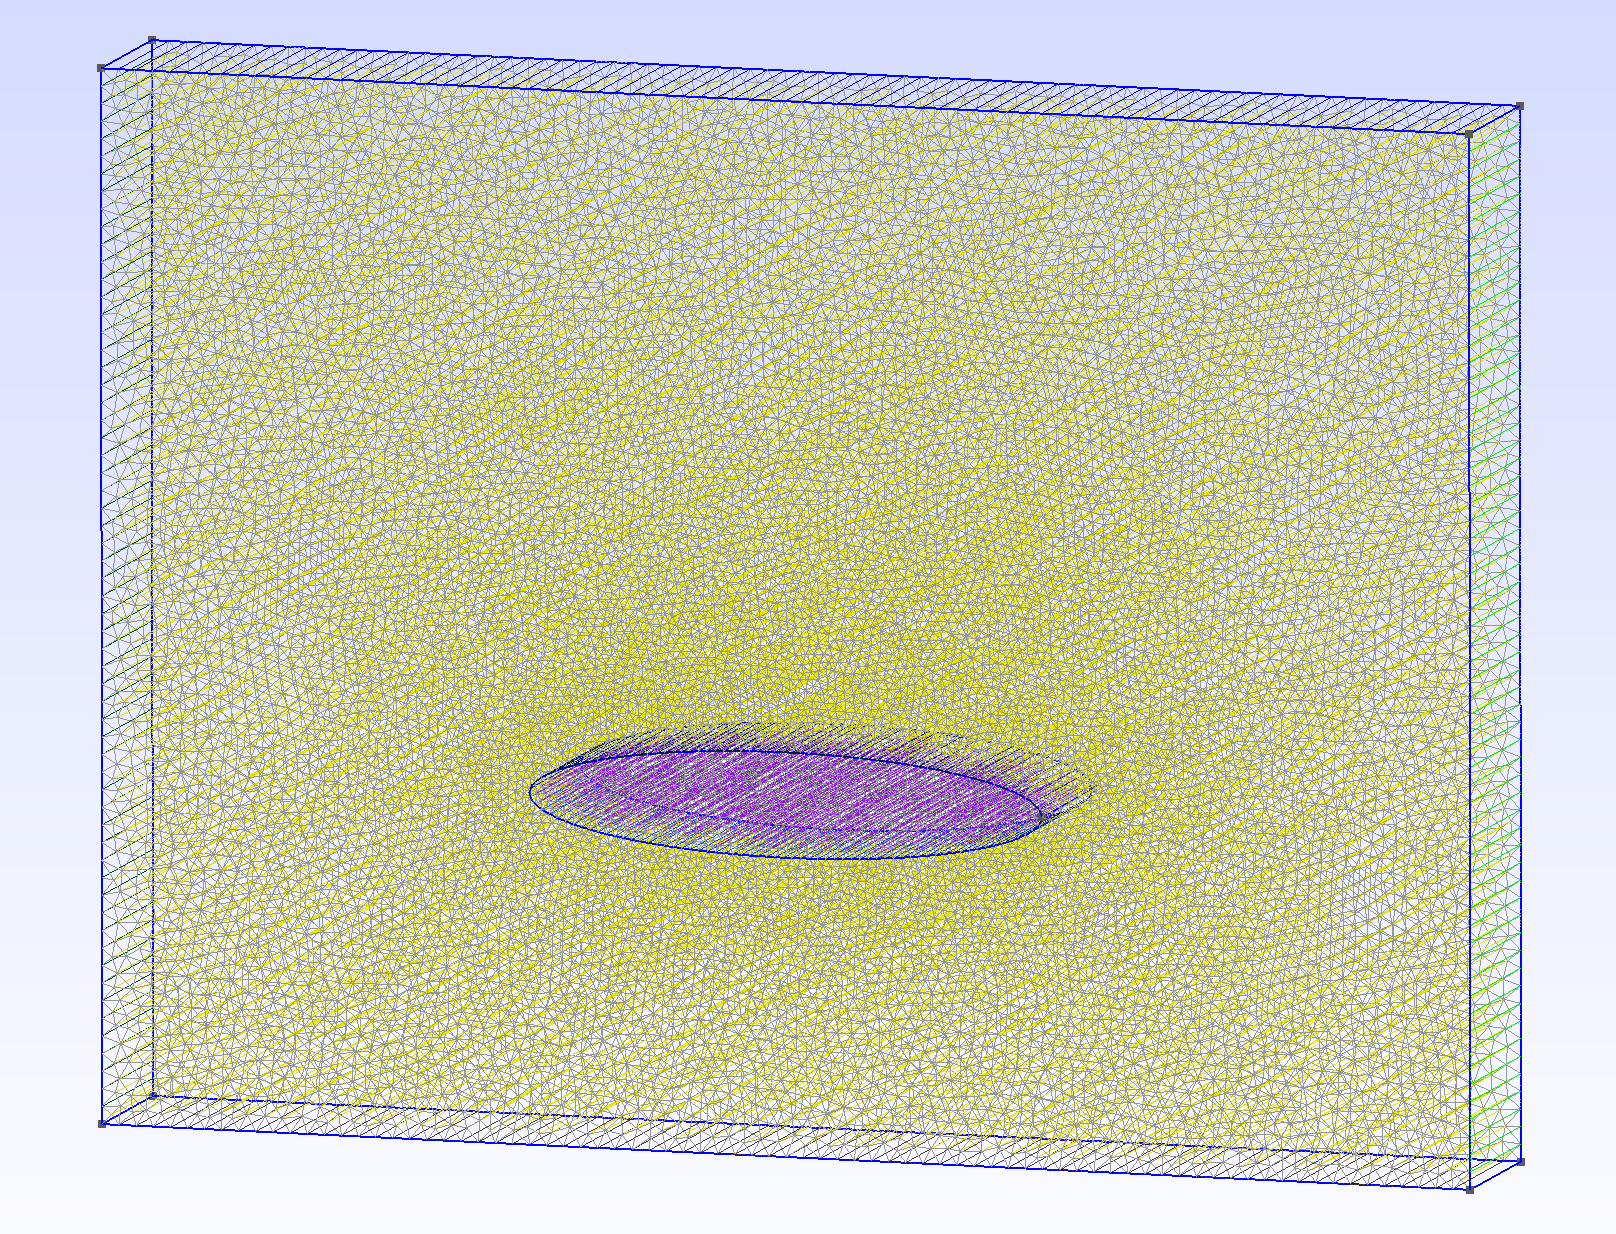
The example case uses a meshing software called Gmsh to create a mesh that resolves the fault zone. Gmsh is already installed within your docker containers, so there should be no need for installing additional software. The gmsh input file is in gmsh/make_mesh.geo.

Fig. 51 Mesh created with gmsh.
Have a look at gmsh/make_mesh.geo and the Gmsh . Check that you (more or less) understand what’s happening and try to change things like fault width and and angle.
It might be helpful to install Gmsh also on your local system so that you can use the graphical user interface to visualize changes made to the .geo file.
Post-processing
There are many ways of extracting information from a completed run. For this project, you will want to know how high the vent temperature is and where the venting occurs, so that you can evaluate if the plume was “captured” by the fault. You can either do this in paraview by using, for example, the “Plot Over Line” filter in Paraview. An alternative is to use the built-in postprocessing function of OpenFoam.
Also check the system/controlDict.orig file; there is codestream section at the bottom that writes out maximum vent temperature to a file names ventT.txt . Modify according to your needs.
postProcess -func sampleDict -latestTime
It will read the system/sampleDict file (have a look!) and extract T along a line.
More powerful is, of course, to use python, like in Upflow temperatures in submarine hydrothermal systems.
Background reading
[Andersen et al., 2017] flow modeling of a cooling intrusion for the Logatchev field
[Aarnes et al., 2010] [Iyer et al., 2017] [Galerne & Hasenclever, 2019] paper on modeling sill intrusion into sedimentary basins
[Svensen et al., 2004] landmark paper on the relationship between sill intrusion into organic sediments, greenhouse gas relase, and climate change as well as mass extinctions.